Article
Sales KPIs: The Numbers a Business Owner Should Track Every Week
Topic · Growth and scaling · 4 min read · Published 13.01.2025 · Updated 23.10.2026
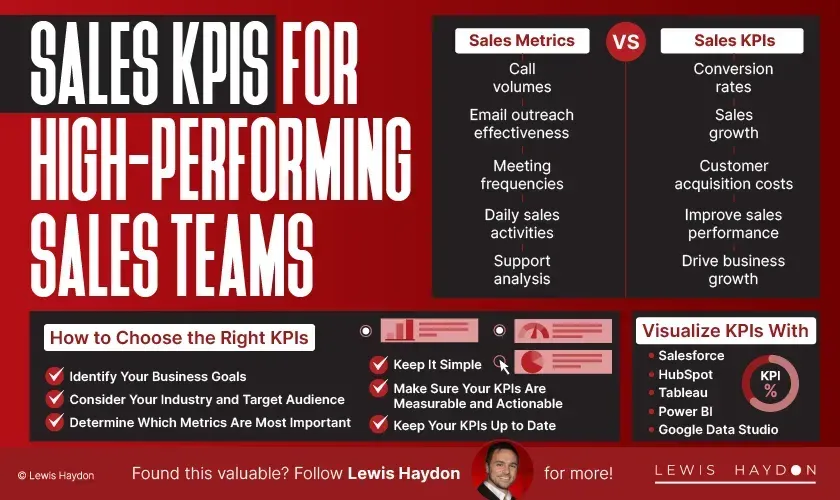
The sales KPIs worth tracking are the handful that predict next month’s sales, not just report last month’s. Start with the outcome you want, usually gross profit from sales, then track the inputs that drive it: qualified enquiries, conversion rate at each stage, average order value, repeat business and the time it takes to win a deal. Keep it to six or eight numbers, make each one measurable and time-bound, and review them every week.
Most owners do the opposite. They track revenue, wait for the accountant, and find out three months later that it was a bad quarter.
Why most sales KPIs don’t help
Your accounts look backwards. They tell you what’s already happened. Revenue on its own is the same: it’s an outcome, and by the time it moves, it’s too late to change it.
What you want is a dashboard that looks forward. If enquiries dropped this month, you know sales will drop in two or three months, and you still have time to do something about it.
The second mistake is tracking too much. Thirty numbers on a report nobody reads is worse than five numbers everyone understands. If you can’t measure it, you can’t scale it, but measuring everything is just another way of not deciding what matters.
Step 1: define the needle
Before you pick a single KPI, decide what you’re trying to move. For most businesses that’s not revenue. It’s gross profit, cash in the bank, or what the business pays you as its owner. Revenue is vanity; profit is sanity.
Everything else on the dashboard is there because it drives that number.
Step 2: track the inputs that drive it
Sales is an outcome. These are the inputs behind it:
| KPI | What it tells you | How to measure it |
|---|---|---|
| Qualified enquiries | Whether enough of the right people are finding you | Number per week that match your ideal customer |
| Enquiry-to-conversation rate | Whether you respond fast and well enough | % of enquiries that become a proper call or meeting |
| Proposal-to-order rate | Whether you’re winning the work you quote for | % of proposals that become orders |
| Average order value | Whether you’re selling the right things, at the right price | Total sales ÷ number of orders |
| Gross margin on sales | Whether the sales are worth having | Gross profit ÷ sales, by product or customer |
| Sales cycle length | How long cash takes to arrive after first contact | Days from enquiry to order |
| Repeat and referral business | Whether customers come back and send others | % of sales from existing customers or referrals |
| Activity | Whether the work behind the numbers is getting done | Calls, meetings and follow-ups per salesperson |
You don’t need all of these on day one. Pick the five or six that match where your business is leaking.
Step 3: make every KPI measurable and time-bound
“Good customer service” isn’t a KPI. Neither is “more sales”. Every KPI needs a number and a time period, so anyone can look at it and say whether you hit it.
- Not “respond quickly”, but “every enquiry answered within four working hours”.
- Not “win more work”, but “30% of proposals converted this quarter”.
- Not “look after customers”, but “40% of sales from existing customers this year”.
Then set a target and a red, amber and green range for each one, so the dashboard tells you at a glance where to look.
Step 4: keep the dashboard simple
A spreadsheet is fine. You don’t need an expensive CRM to start; you need the same numbers, updated the same way, every week. Show this week next to the last few weeks, so you can see the trend, not just a snapshot.
The test: can you look at it for thirty seconds on a Monday morning and know whether sales are on track?
Step 5: review it every week, with the team
A dashboard is only as good as the conversation it starts. Review it at the same time each week. When a number is red, ask what’s driving it and agree who will do what by next week. Then check they did it.
That’s where accountability comes from. Not from the numbers on their own, but from a regular, honest look at them, with consequences when the same number stays red week after week.
Sales KPIs for a small team vs a sales team
- If you’re the main salesperson: track enquiries, conversion rates, average order value and margin. You need to see where your own selling time pays off.
- If you have a sales team: add activity and sales cycle per person, and review them one to one. Pay for outcomes that include margin and repeat business, not just signed orders.
- Either way: add a 30, 60 and 90-day cash flow forecast alongside the sales numbers. It turns a bad week from a sleepless night into a known number you can plan around.
What to read next
- Sales funnel stages, to find the stage where you’re losing the most sales.
- How to improve sales skills, for when the conversion numbers are red.
- How to pay yourself as a business owner, to set the number the whole dashboard serves.
- How to build a high performing team that owns its numbers.
If you’re running the business without a clear set of numbers, that’s the first thing I’d look at with you. You can see how I work and what it costs.