Free tool · Sales plan template
Sales plan template: your target, worked back through the pipeline.
Put in the sales you want this quarter and how deals move through your pipeline. The plan shows the leads, conversations and proposals your team needs every week, and which stage to fix first. Download it for Excel when you’re done.
Strictly private. The figures you type stay on your device. They are never sent to us or kept on our servers. The only details we hold are your name and email.
How to use it
How do you write a sales plan?
A salesperson needs a vehicle: a process that takes the customer from the first contact to the point where they’re happy and referring you. In Dr Lewis Haydon’s words on the podcast, without a process “you’re just winging it”, and if you can’t control the process, you can’t control the customer’s journey or your level of sales. A sales plan puts numbers on that process:
- The sales target for the quarter, and the average sale.
- The stages every deal goes through, and how many move from one stage to the next.
- The activity each week, for each person selling, that makes the target true.
- A weekly check of planned against actual, stage by stage.
“Numbers are the language of business.” Once each stage is measured, you can see which one is leaking, and fix that instead of buying more leads. The full method is on the sales coaching page and in how to build a sales process.
Sales pipeline template: the four stages
The template uses four stages that work for most owner-run businesses, whether you sell a service or a product:
- Lead: someone has got in touch, or you’ve got their details.
- Conversation: a call or meeting that actually happened.
- Proposal: a quote or proposal is with them.
- Won: they’ve said yes and paid, or signed.
Work backwards from the wins:
Proposals needed = wins needed ÷ win rateConversations needed = proposals needed ÷ proposal rateLeads needed = conversations needed ÷ conversation rateSales conversion rate calculator
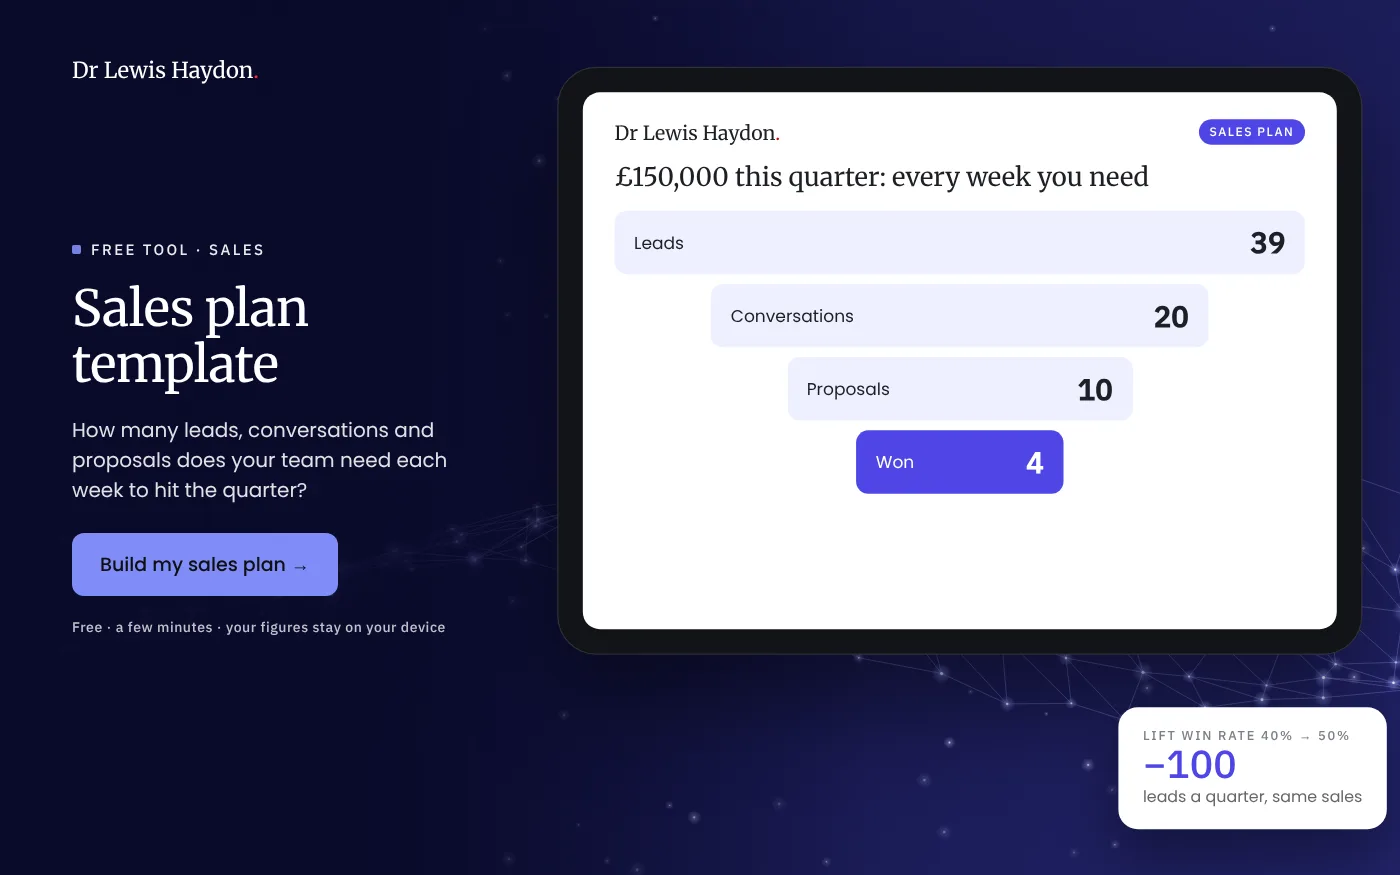
Conversion rate % = number that moved to the next stage ÷ number that started it × 100Lead to customer is every stage multiplied together. At 50%, 50% and 40%, it’s 10%: one in ten leads becomes a customer. That’s why a small change late in the pipeline matters so much. Lift the win rate from 40% to 50% and the same target needs 400 leads instead of 500, without spending a penny more on marketing.
Sales forecast template: what will you actually sell?
Sales forecast = value of proposals out × win rate£375,000 of proposals at a 40% win rate is a £150,000 forecast. Update it every week as deals move or drop out. If the proposals stage is thin this week, the forecast tells you now, not at the end of the quarter.
Sales plan example
The template opens with an example. An owner wants £150,000 of sales this quarter at an average sale of £3,000: 50 wins. At a 40% win rate that’s 125 proposals; at 50% of conversations getting a proposal, 250 conversations; at half of leads becoming a conversation, 500 leads. Over 13 weeks that’s about 39 leads, 20 conversations, 10 proposals and 4 wins a week, or 10 conversations a week for each of the two people selling. With 25 leads coming in a week now, the business is 14 leads a week short, and the cheapest fix is the win rate, not more marketing. If it is more leads, the marketing plan template works out the budget.
Questions people ask
Do you keep my figures?
No. The sums run on your own device: the figures you type are never sent to us or kept on our servers, and they stay strictly private. To see your result you enter your name and email, and those are the only details we hold.
What should a sales plan include?
The sales target for the period; the stages a customer goes through, from lead to won; the conversion rate at each stage; the activity that target needs each week, for each salesperson; and the weekly numbers you will check against it. A plan without the weekly activity is a wish.
What is a sales pipeline?
The deals you are working on, sorted by how close they are to being won: leads, conversations, proposals and won. A healthy pipeline has enough at each stage to hit the target after the ones you lose. If the proposals stage is empty this week, the sales will be short in a month or two.
How do you calculate sales conversion rate?
Divide the number that moved to the next stage by the number that started it, and multiply by 100. 50 proposals and 20 won is a 40% win rate. Lead to customer is all the stages multiplied together: 50% × 50% × 40% is 10%, so one in ten leads becomes a customer.
How do you forecast sales?
Multiply what is in the pipeline by the chance of winning it. £375,000 of proposals at a 40% win rate is a £150,000 forecast. Update it every week as deals move or drop out, and check it against what was actually won.
What is the difference between a sales funnel and a sales pipeline?
The funnel is the shape: lots of leads at the top, fewer customers at the bottom, and the conversion rate between each step. The pipeline is the actual deals in each step today. This template plans the funnel and gives you a weekly pipeline tracker to fill in.
Can I use this in Excel or Google Sheets?
Yes. Fill it in here, then download it as a CSV file. It opens in Excel, Google Sheets or Numbers with your plan and a 13-week tracker for each stage, planned against actual.
Built by Dr Lewis Haydon, a business coach and mentor in Birmingham, UK, who wins his own clients and owns shares in a sales and marketing lead generation business. Related: sales coaching for owners and sales teams, the marketing plan template and the price increase calculator.
Next step
The numbers don’t add up?
Bring your sales plan to a 30-minute virtual coffee and leave with a straight answer on which stage to fix first.
Not sure I’m the right fit? Compare me with other coaches and mentors, honestly, including where others are the better choice. Want something built around your business? Request a tailored quote and I’ll call you to go through it.